Lead generation KPIs are the numbers that tell you if your marketing is actually working. They're the vital signs for your growth engine, showing you what’s generating new prospects and what's falling flat. Forget guesswork; these metrics are about making sharp, data-driven decisions.
Why Lead Generation KPIs Are Your Growth Compass

Running a business without data is like driving with a blacked-out dashboard. Sure, you're moving, but you have no clue how fast you're going, how much fuel is left, or if the engine is about to overheat. Lead generation KPIs are that dashboard—they give you a real-time, unvarnished look at how your growth engine is performing.
These aren't just abstract figures you glance at in a spreadsheet. They are your strategic compass. Tracking the right KPIs is the difference between blindly throwing money at marketing and knowing exactly which moves drive results. It's how you turn marketing from a cost center into a predictable revenue machine.
The Strategic Value of Tracking Performance
Getting lead acquisition right has never been more critical. The global lead generation market is on track to hit over $32 billion by 2035—a massive leap from its current $5.6 billion. With 91% of marketers calling it their number one goal, it’s clear that having a solid measurement strategy is non-negotiable. You can dig into more lead generation statistics to see just how competitive this space is.
When you get serious about monitoring these metrics, your team can:
- Make Smarter Decisions: You’ll know exactly which channels and campaigns are delivering high-quality leads, so you can double down on what works.
- Prove Marketing's Impact: Connect the dots between marketing spend and actual revenue, showing leadership a clear ROI.
- Optimize Your Funnel: Pinpoint the exact spots where potential customers are dropping off and fix the leaks.
- Steer with Confidence: Stop reacting to last quarter's numbers and start making proactive adjustments based on what the data is telling you right now.
In essence, lead generation KPIs provide the language to communicate marketing's value. They allow you to tell a compelling story backed by hard data, showing how every click, form fill, and conversion contributes to the bottom line.
Framing Your Measurement Mindset
Adopting a KPI-driven approach means you stop measuring activity and start measuring outcomes. It's less about "How many emails did we send?" and more about "How many of those emails turned into qualified meetings for sales?"
This mindset shift gets you asking better questions. Instead of, "Did our ad get clicks?" you start asking, "Did our ad attract leads that eventually became high-value customers?" That subtle but powerful pivot is the bedrock of any effective growth strategy. For any business that's serious about predictable, scalable growth, mastering these metrics is step one.
Alright, you've got the lay of the land on lead generation. But knowing the big picture is one thing; knowing which specific dials and gauges to watch is where the real power lies. This is where we get into the core lead generation KPIs—the metrics that cut through the noise and give you the unfiltered truth about your marketing performance.
Don't think of these as scary, complex formulas. Instead, see them as the vital signs for your company's growth engine. Just like a doctor checks your heart rate and blood pressure to get a quick read on your health, a sharp marketer tracks conversion rates and lead costs to diagnose the health of their entire funnel.
Let's break down the essential KPIs you absolutely have to keep an eye on.
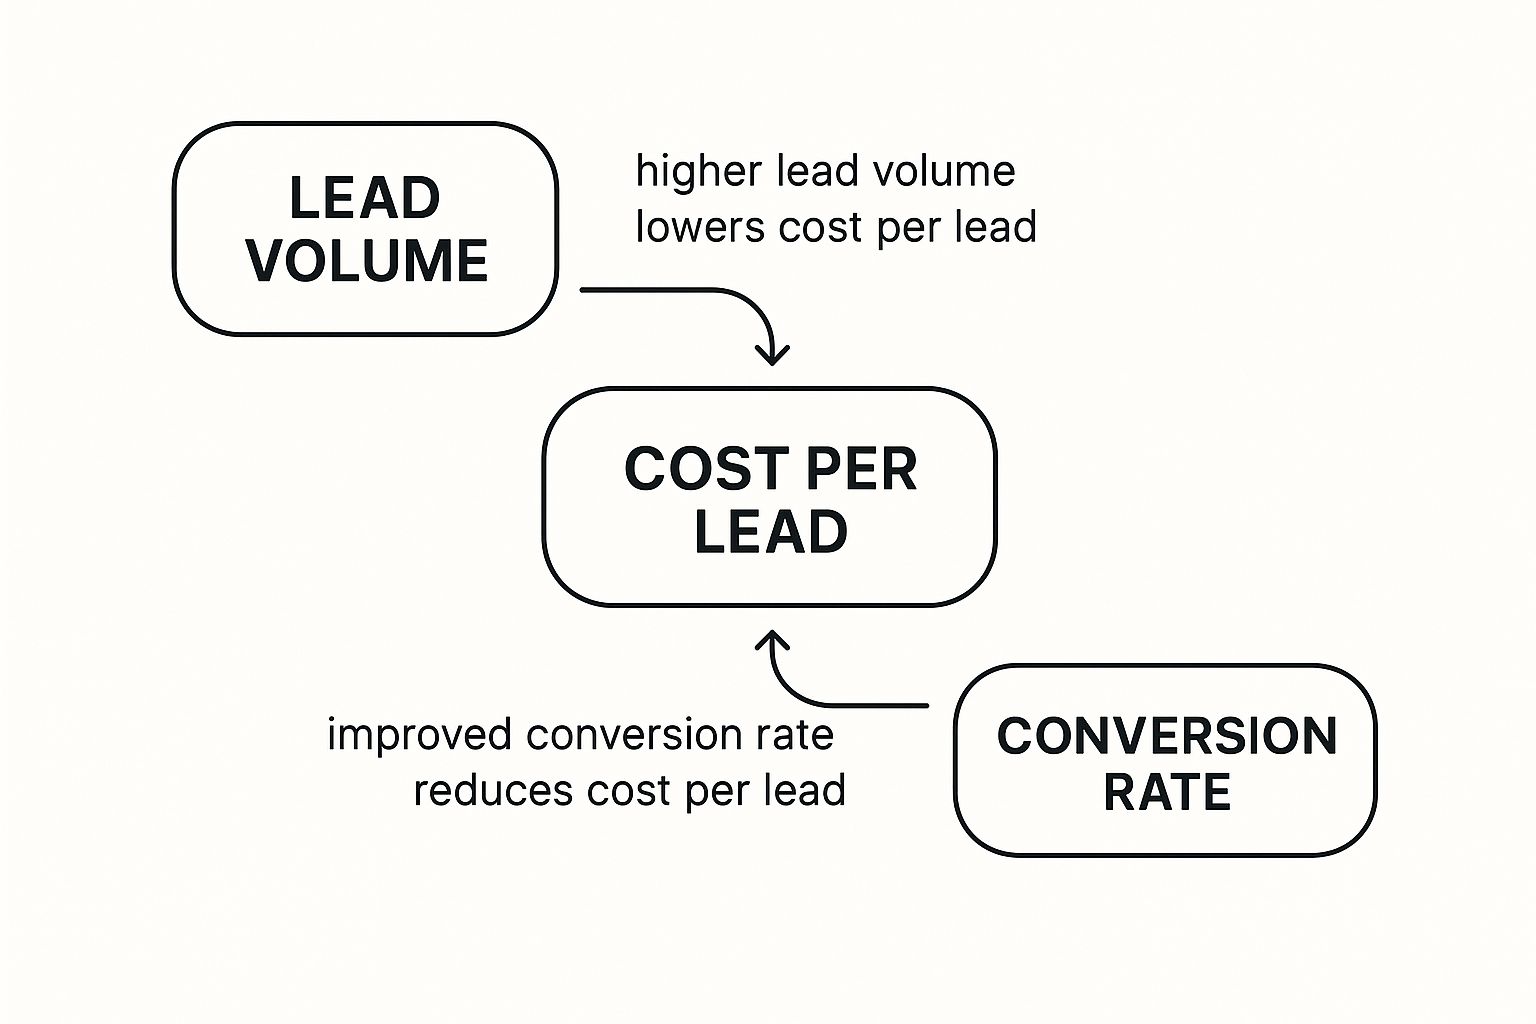
As you can see, bumping up your conversion rate is a massive lever for driving down the cost of getting each new lead in the door.
Conversion Rate: The Ultimate Efficiency Metric
Your Conversion Rate is arguably the most fundamental KPI in the game. It’s the percentage of visitors who take the specific action you want them to, like filling out a demo request form or downloading an ebook. Plain and simple, it’s the ultimate report card on your marketing efficiency.
Think of your website as a physical storefront. All the people who walk in the door are your traffic. But the only ones who really matter are those who actually buy something—those are your conversions. A high conversion rate is a clear sign that your messaging is hitting the mark, your offer is compelling, and you’ve made it incredibly easy for people to say "yes."
Calculating it couldn't be easier:
Conversion Rate = (Total Number of Conversions / Total Number of Visitors) x 100
A low conversion rate is a huge red flag. It tells you there’s a disconnect somewhere between what you're offering and what your audience wants. It could be anything from bland ad copy to a clunky landing page, but this metric points you exactly where to start digging.
Cost Per Lead (CPL): Your Price Tag for Growth
While conversion rate shows how efficient your marketing is, Cost Per Lead (CPL) tells you how cost-effective it is. This KPI calculates exactly how much you’re shelling out to generate a single new lead. It's the literal price tag on your customer acquisition efforts.
Knowing your CPL is absolutely critical for smart budget allocation. If your paid search campaign has a CPL of $50, but your content marketing is pulling in leads for just $25, you have a crystal-clear signal on where your next dollar should go.
The formula is just as straightforward:
CPL = Total Marketing Spend / Total New Leads Generated
Keeping a close watch on your CPL stops you from pouring money into channels that just aren't delivering a return. It makes sure every single dollar you spend is working its hardest to grow your pipeline.
From MQL to SQL: The Quality Control Checkpoint
Let's be real: not all leads are created equal. This is why tracking the journey from a Marketing Qualified Lead (MQL) to a Sales Qualified Lead (SQL) is such a vital KPI. An MQL is a lead that marketing has flagged as promising, while an SQL is one the sales team has personally vetted and accepted as a real, workable opportunity.
Think of your MQL-to-SQL conversion rate as the quality control check on an assembly line. It measures how many of the "parts" (MQLs) built by marketing are actually good enough to move on to the next stage of production with sales.
This metric is non-negotiable for aligning your sales and marketing teams. A chronically low MQL-to-SQL rate almost always points to a mismatch in what marketing thinks is a "good lead" and what sales actually needs, which just leads to wasted effort and internal friction.
So what should you aim for? For many B2B businesses, a solid Lead-to-MQL Rate is around 5%-15%, and a strong MQL-to-SQL Conversion Rate falls somewhere between 13%-27%. Interestingly, one of the best ways to juice these numbers is just to be faster; responding to leads within five minutes can boost conversions by an incredible 21 times. You can dive into more of these lead generation benchmarks to see how you stack up.
By consistently monitoring these foundational lead generation KPIs, you shift from a strategy based on guesswork to one driven by data. They give you the clarity you need to fine-tune campaigns, justify your budget, and build a revenue engine that’s truly predictable.
Moving Beyond Volume to Measure Lead Quality

It’s easy to get caught up in the thrill of watching your lead count climb. But a flood of leads doesn't mean much if none of them ever turn into paying customers. This is a classic marketing trap: prioritizing sheer volume over genuine quality. It drains resources, burns out your sales team, and clogs your pipeline with dead ends.
Let's be real—ten high-intent leads ready to have a conversation are infinitely more valuable than a thousand who will never buy.
Focusing on lead quality flips the script. Instead of asking, "How many leads did we get?" the real question becomes, "How many of our leads have a real chance of becoming customers?" This is where the right KPIs come in, helping you measure actual potential, not just activity. When you track the right things, you can prove your marketing efforts are delivering real opportunities, not just filling a database.
Gauging Potential With Lead Scoring
Think of lead quality like leveling up in a video game. A brand new lead starts at Level 1 with zero points. As they interact with your brand, they complete "quests" that earn them experience points, moving them up the ranks.
This is the core idea behind lead scoring. It’s a system for ranking prospects on a scale that represents how valuable they are to your business. We award points based on who they are (demographics like job title or industry) and what they do (behavioral data like the actions they take on your site).
Here’s a quick look at how a lead might "level up":
- Visits a blog post: +5 points
- Downloads an ebook: +15 points
- Visits the pricing page: +25 points
- Requests a demo: +50 points (Boss Level!)
A lead with a score of 10 is probably just browsing. But someone who's racked up a score of 80 is showing some serious buying intent. This gives you a clear, data-backed way to spot your most engaged prospects, ensuring your sales team spends their time on the deals most likely to close. To really nail this, it's worth exploring various lead scoring best practices.
Key KPIs for Measuring Lead Quality
So, how do you know if your lead scoring model is working or if your channels are bringing in the right people? You need to track a few specific KPIs that tell the real story about the quality of your incoming leads.
1. Lead Source Quality
Not all your marketing channels are going to perform the same. Some, like organic search or referrals, might consistently deliver high-intent leads that close fast. Others, maybe a broad social media campaign, could bring in a ton of leads, but most of them are low-quality. This KPI helps you find your all-star channels.
By tracking which sources produce the most Sales Qualified Leads (SQLs) and customers, you can shift your budget to the channels that deliver the best return. It's about more than just numbers; mastering SEO lead generation, for example, is a fantastic way to turn search traffic into genuinely qualified prospects.
2. Sales Meeting Success Rate
This metric is as direct as it gets for measuring lead quality from the sales team’s point of view. It answers one simple question: How many marketing-generated leads actually result in a held meeting or demo?
A high meeting success rate is a powerful sign that marketing and sales are perfectly aligned on what a "good lead" actually is. It shows the leads being passed over aren't just good on paper—they're genuinely interested and ready for a sales conversation.
If this number is low, it’s a major red flag. It could mean your lead qualification criteria are too loose or that the handoff process is broken. This metric creates a crucial feedback loop, helping marketing refine its targeting and scoring based on what’s actually happening in the field. It shifts the goal from just filling the pipeline to filling it with opportunities that have a real shot at converting.
Connecting Marketing KPIs Directly to Revenue
While metrics like conversion rates and lead quality are fantastic for keeping a pulse on day-to-day operations, the conversation in the boardroom always circles back to one thing: revenue.
To truly prove marketing’s worth, you have to draw a straight line from your activities to the bottom line. This means looking past the tactical KPIs and embracing the metrics that speak the language of the C-suite.
When you can confidently show how every dollar spent on lead generation produces a real return, you shift the narrative. Marketing stops being a "cost center" and becomes a powerful investment engine, solidifying its role as a primary driver of company growth.
Customer Acquisition Cost (CAC)
Your Customer Acquisition Cost (CAC) is one of the most honest numbers in your toolkit. It tells you, in no uncertain terms, the total sales and marketing cost required to land one single new customer.
This isn't just about ad spend. It includes everything—salaries, software subscriptions, agency fees, and all the other overhead that goes into the acquisition machine.
Think of CAC as the final price tag on a new customer. If your company spends $50,000 on sales and marketing in a quarter and brings in 50 new customers, your CAC is $1,000. Knowing this number is the first step toward building a growth model that's actually profitable.
Customer Lifetime Value (CLV)
On the other side of the coin, you have Customer Lifetime Value (CLV). This metric forecasts the total revenue you can expect from a single customer throughout their entire relationship with your company. It answers the big question: "What is this customer actually worth to us over time?"
If CAC is the upfront investment, CLV is the total return. A high CLV is a fantastic sign that you're not just acquiring customers, but you're acquiring the right customers—the ones who stick around, buy more, and fuel your long-term success.
The All-Important CLV to CAC Ratio
Now, let's bring these two powerhouse metrics together. The CLV to CAC ratio is arguably the single most critical indicator of your business's financial health and scalability. It measures the return on investment for every new customer you bring in.
CLV to CAC Ratio = Customer Lifetime Value / Customer Acquisition Cost
Here's how to read it:
- A ratio below 1:1 means you're actively losing money on every new customer. Not good.
- A 1:1 ratio means you're breaking even. You're surviving, but not thriving.
- The gold standard for a healthy, sustainable business is a ratio of 3:1 or higher. For every dollar you spend acquiring a customer, you're getting three dollars back in lifetime value.
This ratio is your business's health score. It tells you if your acquisition strategy is truly profitable and if you have a viable path to scale. For more strategies on maximizing this, check out this guide on how to improve your marketing ROI.
Tying It All Back to Lead Generation ROI
Finally, Lead Generation ROI connects everything back to your specific marketing efforts. While CLV and CAC give you a view of the entire customer journey, this KPI hones in on the direct return from your lead gen campaigns.
This metric proves that the leads filling your pipeline aren't just vanity numbers—they're valuable assets that produce a measurable financial outcome.
It's no surprise that 28.6% of marketers globally now point to direct sales or revenue as their top metric for measuring content marketing success. The pressure is on to show real financial results.
To get this right, you have to meticulously track the journey from initial lead to closed-won deal. Our deep dive on lead management in Salesforce breaks down how to manage that process effectively.
Mastering these revenue-focused KPIs allows you to stop talking about clicks and impressions and start telling a powerful story about growth and profitability.
Channel Performance and ROI Comparison
Not all lead sources are created equal. Some channels might bring in a high volume of cheap leads that never convert, while others deliver fewer, more expensive leads that turn into high-value customers. Tracking ROI by channel is the only way to know where to double down and where to pull back.
Here’s a simple table illustrating how you could compare different channels:
| Marketing Channel | Average Cost Per Lead (CPL) | Average Conversion Rate | Estimated ROI |
|---|---|---|---|
| SEO/Organic | $50 | 4% | 10:1 |
| PPC Ads | $120 | 2% | 5:1 |
| Webinars | $80 | 5% | 8:1 |
| Content Synd. | $65 | 1.5% | 3:1 |
By laying out the data this way, you can see that while content syndication has a lower CPL, webinars and SEO are delivering a much stronger return on investment. This kind of analysis is crucial for optimizing your marketing budget and driving real growth.
How to Build Your Own KPI Dashboard

Knowing your lead gen KPIs is a good start, but tracking them is how you win the game. A well-built dashboard cuts through the noise of raw data and gives you clear, actionable insights into what’s working and what’s burning cash.
Think of it like a pilot's cockpit. It’s your single source of truth for all the critical systems—speed, altitude, fuel—so you can make smart, in-flight adjustments and keep your growth strategy on course. Flying without one? That’s just asking for trouble.
Let's walk through how to build a dashboard that turns data into decisions, using the tools you probably already have on hand.
Choosing Your Dashboard Tools
You don't need to break the bank on some fancy, specialized software to get started. A powerful KPI dashboard is really just about connecting a few common platforms to get all your data talking to each other. The goal is to consolidate everything into one central view.
Your core stack will likely include:
- Google Analytics: This is your go-to for all top-of-funnel website metrics—think traffic sources, page engagement, and on-site conversion rates.
- Your CRM (like Salesforce or HubSpot): This is where the money is. It holds all your bottom-of-funnel data, like MQL-to-SQL rates, deal velocity, and closed-won revenue.
- A Visualization Tool (like Google Data Studio or Tableau): This is the magic ingredient that pulls everything together into charts and graphs that are actually easy to understand.
Structuring Your Dashboard for Clarity
A cluttered dashboard is just as useless as no dashboard at all. The secret to a great layout is to follow the customer's journey. By organizing your KPIs by their stage in the funnel, you create a logical story that flows from initial awareness all the way to the final sale.
Organizing your data this way lets you spot bottlenecks instantly. If your top-of-funnel metrics look great but the bottom-of-funnel numbers are weak, you know exactly where you need to focus your energy.
Here’s a simple framework to get you started:
1. Top of Funnel (Awareness & Acquisition)
- Focus: How are we getting people in the door?
- KPIs: Website Traffic (by channel), Click-Through Rate (CTR), Cost Per Click (CPC).
2. Middle of Funnel (Conversion & Qualification)
- Focus: Are visitors turning into leads? And are they any good?
- KPIs: Conversion Rate (by landing page), Cost Per Lead (CPL), MQL Volume, Lead Quality Score.
3. Bottom of Funnel (Revenue & ROI)
- Focus: Are our leads actually turning into paying customers?
- KPIs: MQL-to-SQL Conversion Rate, Customer Acquisition Cost (CAC), Sales Cycle Length, Lead Generation ROI.
This tiered structure helps you diagnose problems at every level. Getting the strategy right for each stage is crucial, which is why digging into different approaches to lead generation and inbound marketing can give you the context needed to nail your own.
Setting a Cadence for Review
A dashboard only works if you actually look at it. You need to build a regular review cadence into your team's workflow to turn those insights into action. The key is to remember that not all metrics need the same level of attention.
- Daily/Weekly Review: Keep an eye on the fast-moving, tactical stuff. This includes metrics like website traffic, new leads, and ad spend. It’s all about catching immediate campaign problems before they spiral.
- Monthly/Quarterly Review: This is for the big picture. Analyze the slower-moving, strategic KPIs like CAC, CLV, and overall ROI. These numbers inform your high-level strategy and bigger budget decisions.
When you build a clear, logically structured dashboard and commit to a regular review process, you stop just collecting data. You start actively using your KPIs to steer your business toward predictable, sustainable growth.
Got Questions About Lead Generation KPIs?
Once you start digging into lead generation KPIs, the questions start popping up. It's totally normal. Moving from just knowing the definitions to actually using these numbers to make smart decisions in the real world is a big leap.
Think of this as a quick field guide to get you past some of the most common hurdles. Let's clear up the confusion so you can manage your tracking with confidence.
How Often Should I Review My Lead Generation KPIs?
This is a great question, and the answer isn't "all of them, all the time." The right cadence depends entirely on the metric and how fast it moves. Lumping all your KPIs into one bucket is a surefire way to either miss a fire you need to put out or waste hours staring at data that barely budges.
You've got to think like the captain of a ship. You're constantly glancing at your speed and the compass, but you only check the long-range weather forecast a couple of times a day. Your KPIs need a similar rhythm.
- Daily or Weekly Checks: These are your front-line, tactical metrics. We're talking daily lead volume, click-through rates (CTR) on your live ads, and website traffic. Think of them as your early-warning system—they’ll flash red the moment a campaign starts to go sideways.
- Monthly or Quarterly Reviews: Save this rhythm for your big-picture, strategic KPIs. Metrics like Customer Lifetime Value (CLV) and Customer Acquisition Cost (CAC) don't swing wildly from one day to the next. Looking at them monthly or quarterly gives you a stable view to guide major budget decisions and strategy shifts.
A solid system is to have a quick weekly huddle with the team to go over the operational numbers, and a more formal monthly review with leadership to talk about the strategic stuff. This way, you're both steering the ship correctly day-to-day and making sure you're still sailing toward the right destination.
What Are the Biggest Mistakes to Avoid When Tracking KPIs?
It’s surprisingly easy to get lost in the weeds. A lot of teams fall into the same traps, turning what should be a powerful tool for growth into just a bunch of confusing spreadsheets. Knowing these pitfalls is the first step to avoiding them.
Here are the big ones we see all the time:
- Chasing Vanity Metrics: This is, without a doubt, the number one mistake. Focusing on numbers like social media likes or total impressions feels good, but they tell you absolutely nothing about the health of the business. Every single KPI you track must have a clear line back to revenue.
- Getting Hit with Analysis Paralysis: More data isn't always better. Tracking too many KPIs at once is like trying to drink from a firehose—you're drowning in information but have zero actual insight. Stick to a core set of 5-7 metrics that are tightly connected to your main business goals.
- Forgetting to Segment Your Data: Looking only at a single, blended average is incredibly dangerous because it hides the truth. That "good" overall conversion rate could be masking one channel that's knocking it out of the park and another that's just a black hole for your budget. Always, always slice your data by channel, campaign, and audience.
Which KPIs Are Most Important for a B2B SaaS Company?
For B2B SaaS, the name of the game is long-term value. You aren't making quick, one-off sales. The sales cycles are longer, and the entire business is built on strong customer relationships. Your KPIs have to reflect that reality.
Sure, top-of-funnel metrics matter, but the KPIs that really move the needle for a SaaS company are the ones that measure lead quality and long-term profitability.
Your dashboard should be centered on these:
- MQL to SQL Conversion Rate: This is your best proxy for lead quality. It answers the simple question: "Is marketing sending leads that sales actually wants to talk to?"
- Sales Cycle Length: How long does it take to turn a new lead into cold, hard cash? This number directly impacts your financial forecasting and cash flow.
- Customer Acquisition Cost (CAC): In a business where each customer can be worth thousands, you absolutely have to know what it costs to get them in the door. It's essential for scaling without breaking the bank.
- Customer Lifetime Value (CLV): This is the ultimate report card. It reflects the total revenue a single customer will bring you over their entire time with your company.
In the end, the CLV to CAC ratio is the true north star for any SaaS business. A healthy ratio, usually 3:1 or higher, is the clearest signal you have a sustainable, profitable growth engine on your hands.
Ready to turn more of your hard-earned leads into scheduled meetings? Distro connects directly to your demo request forms, intelligently routing high-intent prospects to the right sales rep’s calendar in seconds. Stop letting valuable leads slip through the cracks and see how automated scheduling can triple your conversion rates.