Let's be honest, "sales efficiency" can sound like another piece of corporate jargon. But what it really boils down to is measuring how much real revenue you're generating for every dollar and hour you sink into your sales and marketing machine.
These metrics are your canary in the coal mine. They tell you whether your growth engine is a finely-tuned machine or just burning through cash with little to show for it. Think of it as a much-needed health check for your entire revenue strategy.
Why Sales Efficiency Is Your New North Star
This isn't about pushing your team to simply "work harder." That's a race to the bottom. It’s about giving them the tools and insights to work smarter.
Imagine your sales process is a leaky bucket. You can keep pouring more and more leads into the top—and many companies do—but if that bucket is riddled with holes, you're just wasting good pipeline. Most of that potential revenue will drain right out before it ever hits the bottom line.
Sales efficiency metrics are how you find and patch those leaks. They force you to look at the true cost and return of your growth efforts, shifting the focus from vanity metrics (like call volume) to what actually matters: profitable outcomes.
The Real Cost of Inefficiency
Ignoring these metrics isn't an option. It has real, tangible consequences that can grind even the most promising companies to a halt. The sales world is tough out there. In fact, one recent report found that a staggering 84% of sales representatives didn't even hit their quotas last year. This isn't just a coincidence; widespread underperformance like this almost always points back to friction in the sales process and a strategy that isn't guided by data. You can dig into more of these eye-opening sales performance statistics on spotio.com.
When efficiency gets pushed to the back burner, companies usually start to see a few familiar problems pop up:
- Bloated Customer Acquisition Costs (CAC): You find yourself spending more and more to land each new customer, which slowly eats away at your margins.
- Stagnant Growth: Eventually, you hit a revenue plateau because the cost of acquiring new business becomes completely unsustainable.
- Burned-Out Sales Reps: Nothing kills morale faster than working tirelessly on broken processes. Reps get frustrated when they're putting in the effort but still can't hit their numbers.
- Unpredictable Forecasting: Without a clear grasp of your efficiency, forecasting revenue becomes a total guessing game instead of a predictable, data-backed outcome.
By focusing on sales efficiency, you fundamentally change your mindset from "more effort" to "better results." It’s about building a predictable, profitable, and scalable sales machine that gets the absolute most out of every single resource you invest.
Before we dive into the nitty-gritty of calculating and improving these metrics, let's get a high-level view of the core concepts we'll be covering.
Core Sales Efficiency Concepts at a Glance
This table breaks down the main pillars of sales efficiency. Think of it as a quick reference guide that connects each concept to a direct business goal and its ultimate impact.
| Efficiency Concept | Primary Goal | Business Impact |
|---|---|---|
| Sales Velocity | Speed up the deal cycle from lead to close. | Faster revenue recognition and improved cash flow. |
| CAC Payback Period | Recoup the cost of acquiring a new customer faster. | Increased profitability and capital efficiency. |
| Sales Magic Number | Measure revenue growth from sales & marketing spend. | Justifies investment in growth initiatives. |
| Sales Rep Productivity | Maximize the output of each sales representative. | Higher quota attainment and lower team turnover. |
Each of these concepts gives you a different lens through which to view your GTM strategy, helping you pinpoint exactly where your efforts are paying off and where they're falling short.
This guide will walk you through everything you need to know about these essential metrics. We’ll get into how to calculate them, what the numbers are actually telling you, and—most importantly—what you can do to move them in the right direction. The goal is simple: to help you move beyond just tracking activity and start optimizing for what truly matters—sustainable, profitable growth.
The Sales Efficiency Metrics That Matter Most
Alright, we've covered why sales efficiency is a critical lens for your business. Now, let's get into the what. Think of tracking the right metrics like having a reliable GPS for your revenue journey—it tells you exactly where you are, where you're headed, and the best route to get there.
Below is a breakdown of the key sales efficiency metrics your team should have on its radar. We’ll dig into what each one reveals, how to calculate it, and what it actually looks like in the real world.
To help you visualize these core performance indicators, picture them as gauges on a digital dashboard.
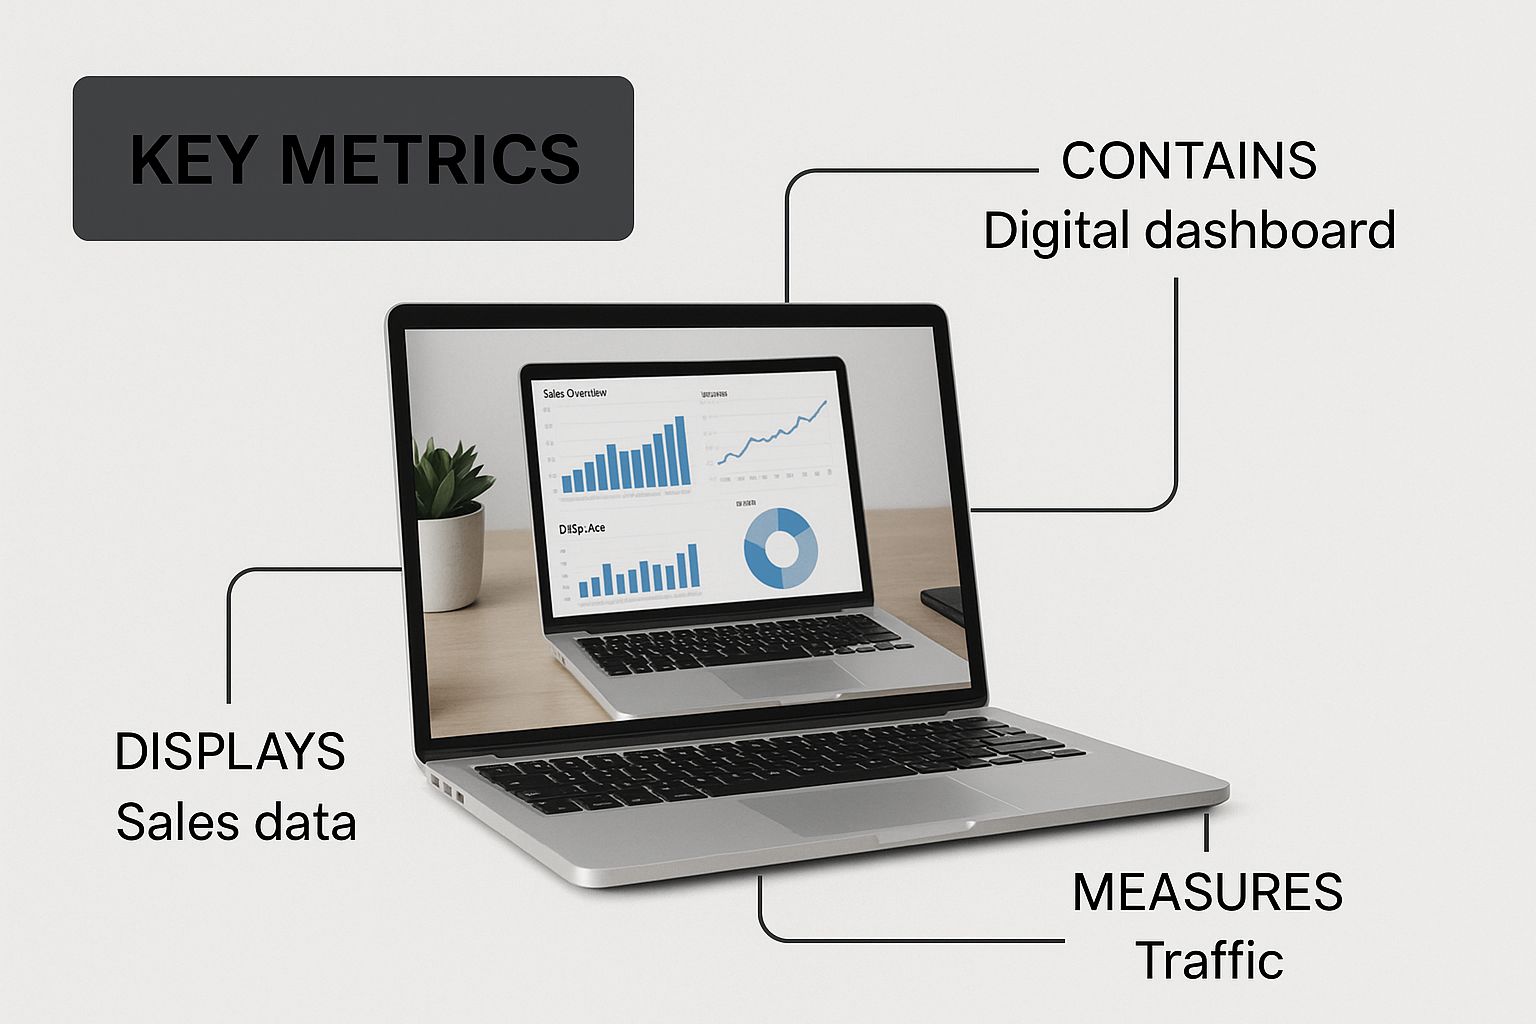
This dashboard view shows how different metrics like Win Rate, Sales Velocity, and Payback Period are all interconnected, giving you a complete picture of your sales engine's health.
The Sales Efficiency Ratio (Magic Number)
This one is often called the "Magic Number," especially in the SaaS world, and for good reason. It's the gold standard for measuring the return on your growth investments. It answers a simple but vital question: for every dollar we spent on sales and marketing last quarter, how many dollars of new revenue did we generate this quarter?
- Formula: (Current Quarter's New ARR * 4) / (Previous Quarter's Sales & Marketing Spend)
- What it reveals: It shows the pure capital efficiency of your growth engine. A number below 0.75 suggests you're spending too much for too little return. A number hovering around 1.0 indicates efficient, sustainable growth. Anything above 1.0 is exceptional.
Imagine a startup spends $100,000 on sales and marketing in Q1 and generates $30,000 in new Annual Recurring Revenue (ARR) in Q2. Their Magic Number is 1.2, signaling a highly efficient growth model that practically screams for more investment.
CAC Payback Period
This metric is all about time. Specifically, it tells you how long it takes to earn back the money you spent to acquire a new customer. A shorter payback period is a beautiful thing—it means you get your investment back faster, freeing up cash to go out and acquire the next customer.
- Formula: Customer Acquisition Cost (CAC) / (Average Revenue Per Account * Gross Margin %)
- What it reveals: It's a direct measure of your capital efficiency and runway to profitability. A long payback period, often stretching over 12-18 months, can seriously strain cash flow and put the brakes on growth.
Let's say your CAC is $6,000 and a customer pays you $500 a month with an 80% gross margin. Your payback period comes out to 15 months ($6,000 / ($500 * 0.80)). Shortening this is a top priority for any sales operation. Dialing in your team's processes is a direct path to better results, and you can explore more strategies in our guide on sales operations best practices.
Sales Velocity and Sales Cycle Length
These two are joined at the hip. They both measure the speed of your sales pipeline. Sales Velocity tells you how much revenue you’re closing per day, while Sales Cycle Length measures the average time from first "hello" to a closed deal.
Improving pipeline speed has a massive impact on revenue. Data shows that shortening sales cycles by just 15-20% can boost annual revenue by up to 25%—a huge gain without hiring a single new rep.
Here’s how to think about them:
- Sales Velocity: This metric rolls up multiple factors into a single number representing pipeline speed. The formula is (Number of Opportunities x Average Deal Size x Win Rate) / Sales Cycle Length.
- Sales Cycle Length: This is a simpler metric. Just find the average number of days between the first contact with a prospect and the day the deal is officially closed.
A sluggish sales velocity is a major red flag. It often points to hidden friction in your process, like a convoluted contracting stage or weak lead qualification wasting everyone's time.
Win Rate
Last but not least, your Win Rate is one of the most straightforward yet powerful sales efficiency metrics out there. It simply calculates the percentage of all qualified opportunities your team successfully closes.
- Formula: (Number of Closed-Won Deals / Total Number of Opportunities) * 100
- What it reveals: This metric is a direct reflection of your team's effectiveness at turning pipeline into actual revenue. A low win rate might signal issues with product-market fit, intense competitor pressure, or a clear need for better sales training. It's the ultimate gut check.
Decoding Your Sales Efficiency Ratio
Of all the sales efficiency metrics you can track, one really tells the whole story, especially for SaaS and subscription businesses. We call it the Sales Efficiency Ratio, but you’ve probably heard it called the "Magic Number."
This metric gets straight to the point. It answers the one question every leadership team obsesses over: for every dollar we pour into sales and marketing, how many new dollars of annual revenue are we actually getting back? It’s the ultimate reality check on your growth spending.
Calculating it is surprisingly simple. You just take the new Annual Recurring Revenue (ARR) you generated in a given quarter and divide it by your total sales and marketing expenses from the quarter before. That time lag is crucial—it gives your investments a chance to actually turn into revenue.
Sales Efficiency Ratio = New ARR / Sales & Marketing Spend
Let's say you spent $200,000 on sales and marketing in Q1. In Q2, that investment brought in $180,000 in new ARR. Your ratio would be 0.9. That single number tells you a ton about your company's health and whether you're ready to scale.
Interpreting Your Magic Number
The real magic happens when you know what your number means. It’s not just some figure for a spreadsheet; it’s a direct signal about how efficiently you're using your cash and if you're truly ready to hit the gas.
Here's a quick and dirty guide for what your Magic Number is telling you, based on what we see across the industry:
- Below 0.75: This is a red flag. It means your growth engine is sputtering. You're spending too much cash for too little return, and it’s time to pop the hood and find out what’s wrong before you even think about spending more.
- Near 1.0: This is the sweet spot. A 1.0 ratio means you’re getting back a dollar in new revenue for every dollar you invest. Your model is sustainable, capital-efficient, and you can feel good about continuing to invest in growth.
- Above 1.0: You're crushing it. This indicates a seriously efficient growth machine where your investments pay for themselves in less than a year. If you're in this zone, you have a green light to scale aggressively.
Knowing where you stand is step one. The next step is figuring out how to push that number higher, which usually means taking a hard look at your entire go-to-market strategy. For a deeper dive into tuning up your pipeline, our guide on sales process optimization has some great, actionable steps.
Avoiding Common Calculation Pitfalls
Getting an accurate Sales Efficiency Ratio means being brutally honest about what goes into your "Sales & Marketing Spend." This is where so many companies trip up, ending up with a number that paints a rosier—or sometimes bleaker—picture than reality.
Your calculation needs to include the fully-loaded cost of your growth teams. We're talking everything:
- Salaries and Commissions: Base pay, bonuses, and commission for everyone in sales, marketing, and any customer success folks involved in landing new business.
- Overhead Costs: Don't forget payroll taxes, benefits, and any other overhead tied to those team members.
- Program & Tool Spend: Every last dollar spent on marketing campaigns, ads, software tools (your CRM, automation platforms, etc.), and event sponsorships.
If you want to really understand what's driving your ratio, you need to know which channels are pulling their weight. This is where things like Salesforce marketing attribution strategies come in. When you can correctly tie revenue back to specific campaigns, you can spend smarter and give your Magic Number a serious boost.
Shortening Your CAC Payback Period

It’s not just about what it costs to land a new customer. The real test of your capital efficiency is how fast you earn that investment back. This is where the CAC Payback Period becomes one of your most powerful sales efficiency metrics.
Think of it as the refresh rate for your growth engine. The faster you get your money back, the faster you can plow that same dollar into acquiring the next customer. A short payback period is a tell-tale sign of a healthy, self-sustaining business poised for rapid growth.
The calculation itself is pretty simple, telling you exactly how many months it takes for a new customer to generate enough gross margin to cover their acquisition cost.
CAC Payback Period = Customer Acquisition Cost (CAC) / (Average Revenue Per Account * Gross Margin %)
A stubbornly long payback period—anything over 12 months is a common red flag—is like driving with the emergency brake on. It ties up precious cash that should be fueling your expansion. The name of the game is to shrink this timeline as much as possible.
Dual-Pronged Strategy for a Faster Payback
Shortening your payback period isn't about finding one silver bullet. It's about attacking a two-sided equation: you have to lower your acquisition costs while simultaneously increasing the immediate value each new customer brings in.
When you tackle both sides at once, you create a powerful compounding effect that can dramatically accelerate your path to profitability for every single account.
Prong 1: Lower Your Customer Acquisition Cost (CAC)
The most direct route to a shorter payback period is to simply spend less to acquire each customer. This is where you roll up your sleeves and dig into strategies to reduce Customer Acquisition Cost (CAC).
A few key moves usually make the biggest impact:
- Optimize Your Marketing Channels: Go all-in on your most cost-effective channels and don't be afraid to cut the cord on underperformers.
- Improve Conversion Rates: A bump in conversion rate at any stage of the funnel means more customers for the same spend, which directly lowers your CAC.
- Refine Your Ideal Customer Profile (ICP): When you focus your energy on prospects who are a perfect fit, you naturally shorten sales cycles and waste less time and money.
Prong 2: Boost Early Customer Value
The other side of the coin is to squeeze more revenue and margin out of a customer right from the get-go. This makes each new account more profitable from day one, helping you recoup your CAC in record time.
You can make this happen with a few smart approaches:
- Strategic Pricing and Packaging: Structure your pricing tiers to nudge new customers toward higher-value plans right from the start.
- Effective Upselling and Cross-selling: Don't wait a year to expand an account. Build processes to increase customer value early in their journey.
- Improve Your Gross Margin: Take a hard look at your cost of goods sold (COGS) and support costs. Even tiny improvements in your gross margin can have a massive impact on your payback period.
Practical Ways to Improve Your Key Metrics
Alright, you've got your numbers. You know what your sales efficiency metrics are. Now for the important part: what do you actually do with them?
Knowing your Win Rate is low or your Sales Velocity is sluggish is one thing. Fixing it is a whole different ballgame. This is where we bridge the gap between insight and action, giving you a toolkit of proven strategies to get those numbers moving in the right direction.
These aren't just theories. They're practical, real-world steps you can take to target the weak spots in your sales process and build a more predictable, profitable growth engine.
How to Juice Your Sales Velocity
Sales Velocity is all about speed. The faster you can hustle deals through your pipeline, the faster you get to recognize that sweet, sweet revenue. If this metric is lagging, it's a huge red flag that unnecessary friction is slowing your team down.
So, where's the best place to start? Two of the biggest culprits are how you handle leads and how you finalize contracts.
Stop Treating All Leads Equally: Not all leads are ready to buy. A lead scoring model is a game-changer here. It automatically assigns points to prospects based on who they are and how they engage with you. This lets your reps instantly zero in on the hottest, most qualified leads instead of wasting precious time on folks who are just kicking tires.
Kill the Contracting Bottleneck: Nothing kills momentum like a deal getting stuck in legal limbo. The final stage is often where deals go to die, thanks to endless back-and-forth on terms. You can streamline this by creating pre-approved contract templates and giving your team clear guidelines for negotiation. Empower your reps to close, not just wait. A great way to boost efficiency here is by automating your sales process from lead to close.
How to Shrink Your Sales Cycle
A long sales cycle is a massive drain on your resources. Worse, every extra day increases the risk of the deal going completely dark. The secret to shortening it is taking control and making sure you're only investing time in opportunities that have a real shot at closing.
By proactively guiding the sales process and rigorously qualifying prospects, you create a pipeline filled with high-intent leads that move forward with purpose and predictability.
Think about putting these two powerful tactics to work:
- Build Mutual Action Plans (MAPs): A MAP is a simple, shared document outlining the steps, who's responsible for what, and the timeline for both you and the prospect. It creates accountability and a clear roadmap, preventing deals from stalling out just because nobody knows what's next.
- Get Ruthless with Qualification: Don't be afraid to disqualify leads early and often. Using a framework like BANT (Budget, Authority, Need, Timeline) or MEDDIC forces you to ask the hard questions upfront. This ensures your reps focus their energy where it counts—on deals they can actually win. For more ideas, our guide on how to improve sales productivity is packed with actionable advice.
How to Drive Up Your Win Rate
Your Win Rate is the ultimate report card for your sales team. Getting this number to climb means getting deep into your buyer's head and understanding your market inside and out. When you can consistently prove your value and build trust, the wins will follow.
Here are two areas to focus on for a real competitive edge:
- Become a Competitor Expert: Don't just know who your competitors are. Dig deep. Analyze their messaging, pricing, and customer reviews to find their weaknesses. Arm your sales team with battle cards and specific talking points that highlight your unique strengths and shut down common objections.
- Weaponize Your Happy Customers: People trust other buyers way more than they trust salespeople. Make social proof a core part of your sales motion. Weave customer testimonials, compelling case studies, and glowing reviews into your presentations and follow-up emails. It builds instant credibility and makes saying "yes" a whole lot easier for the prospect.
To tie it all together, here’s a quick reference table. Think of it as a diagnostic tool: identify your challenge, see the metric it affects, and find a strategy to fix it.
Strategies to Boost Core Sales Efficiency Metrics
| Challenge | Associated Metric | Improvement Strategy |
|---|---|---|
| Reps waste time on poor-fit leads | Sales Velocity, Win Rate | Implement a lead scoring model to prioritize the most engaged prospects. |
| Deals stall in the final stages | Sales Cycle Length, Sales Velocity | Create pre-approved contract templates to remove legal bottlenecks. |
| Prospects go dark or lose momentum | Sales Cycle Length | Use Mutual Action Plans (MAPs) to create a shared timeline and accountability. |
| Pipeline is full but few deals close | Win Rate, Sales Cycle Length | Refine your qualification criteria (e.g., BANT, MEDDIC) to disqualify early. |
| Losing deals to the competition | Win Rate | Conduct advanced competitor analysis to create specific battle cards. |
| Prospects are hesitant or skeptical | Win Rate, Sales Cycle Length | Weave social proof and case studies into every stage of the sales process. |
By focusing on these practical improvements, you move beyond simply tracking metrics. You start actively managing them. Each small adjustment—whether it’s a new qualification question or a templated contract—compounds over time, leading to a more efficient, predictable, and successful sales machine.
Common Questions About Sales Efficiency
Getting started with sales efficiency metrics can feel like you're learning a new language. It’s totally normal to have questions as you shift from just tracking activity to measuring real business impact.
Let's dive into some of the most common hurdles I see leaders face and get you some clear, actionable answers. Remember, the goal isn't perfection on day one. It's about making steady, informed progress.
Where Do I Start If I Am Not Tracking Anything?
I get it. The idea of setting up a whole suite of new metrics can be paralyzing. The good news is, you don't need a sophisticated analytics platform right away. The key is to just start simple.
Your existing tools probably hold the answers you need. A great starting point is to focus on just two foundational numbers: your total sales and marketing spend and the new revenue you’ve brought in.
- Step 1: Pull your sales and marketing expenses for the last quarter. Your accounting software has this.
- Step 2: Tally up the new contract value (or new ARR) generated in the current quarter. Your CRM has this.
- Step 3: Divide that new revenue by the spend.
Boom. That’s a baseline Sales Efficiency Ratio. It won't be perfect, but it gives you an immediate snapshot of your growth engine's health and a real number to start improving.
What Is a Realistic Sales Efficiency Ratio?
This is the million-dollar question, and the honest answer is: it depends. There is no magic number that works for every company. Your company's stage, industry, and growth strategy all play a huge role.
Think of it like this: an early-stage startup burning cash to capture market share will have a very different "healthy" ratio than a mature, established enterprise focused on profitability. The startup might be fine with a ratio below 0.5, while the enterprise is aiming for well above 1.0.
As a general rule of thumb:
- Early-Stage Startups: Often prioritize hyper-growth over efficiency. A ratio of 0.5 to 0.75 is often acceptable as they nail down product-market fit.
- Growth-Stage Companies: Should be aiming for a ratio that's getting close to 1.0. This shows you've found a sustainable, capital-efficient growth model.
- Established Enterprises: Are typically looking for a ratio above 1.0, which signals a highly profitable and dominant market position.
How Often Should We Review These Metrics?
Looking at your metrics sporadically won't drive any real change. You need a regular rhythm, but you don't need to review everything all at once. The key is to match the review frequency to the metric's purpose.
Here’s a practical schedule that works for most teams:
- Monthly Operational Check-ins: This is the time for tactical metrics like Win Rate and Sales Cycle Length. This cadence lets you spot negative trends early and make quick adjustments, like refining your qualification criteria or updating sales collateral before things get out of hand.
- Quarterly Strategic Reviews: Save these for the big-picture metrics like the Sales Efficiency Ratio and CAC Payback Period. A quarterly view smooths out the monthly noise and gives you a much clearer picture for making strategic calls on budget, headcount, and your overall growth plan.
This dual cadence ensures you’re keeping a finger on the operational pulse while also steering the strategic ship with confidence.
Ready to stop letting high-intent leads slip through the cracks? Distro automatically routes qualified prospects from your forms to the right sales rep's calendar in seconds, eliminating costly delays and multiplying your conversion rates. Book a demo with Distro today!