Your sales conversion rate is the finish line of your sales process. It's the percentage of prospects who take that final step and become paying customers. Think of it as the ultimate scorecard for your sales motion; it tells you exactly how good you are at turning a "maybe" into a "yes."
A higher rate is a great sign. It means your team, your product, and your messaging are all clicking.
What Is Sales Conversion Rate and Why It Matters

Let's use a simple analogy. Imagine you run a bakery. Every person who smells the fresh bread and walks through your door is a lead. But only the ones who actually buy something "convert." Your sales conversion rate is just the percentage of those people who became paying customers. It’s the pulse of your business, showing how effectively you turn curiosity into cash.
This metric is so much more than a number on a dashboard. It’s a direct reflection of how well you connect with your customers and solve their problems. A high rate is proof that your sales process is humming, your value prop is crystal clear, and your product genuinely hits the mark with your audience.
On the flip side, a low rate is a major red flag. It tells you there's friction somewhere in your sales funnel that needs your immediate attention.
The True Impact of Conversion Metrics
Getting a handle on this concept is the first real step toward meaningful growth. It lets you stop guessing and start making decisions backed by actual data. By tracking your sales conversion rate, you can pinpoint what’s working, what’s falling flat, and where your biggest opportunities are hiding.
For instance, a ton of new leads might feel like a win, but if almost none of them are converting, you've got a problem. It could be a lead quality issue or a breakdown in your follow-up. Maybe you're attracting the wrong crowd or just failing to engage prospects once they raise their hand.
Tracking conversion rates isn't about judging performance; it's about gaining clarity. It transforms vague problems like "we need more sales" into specific, actionable challenges like "we need to improve our demo-to-close ratio."
Ultimately, focusing on your sales conversion rate pushes your team to work smarter, not just harder. It shifts the entire focus from busywork to bottom-line results.
Key Reasons to Track Your Sales Conversion Rate
Keeping a close eye on this metric brings a few critical benefits that directly impact your revenue and efficiency. Here’s why it needs to be front and center for your team:
- It Measures Sales and Marketing Alignment: A strong conversion rate is often the best sign that marketing is sending over quality leads and the sales team knows exactly how to handle them.
- It Reveals Funnel Weaknesses: Noticing a big drop-off at a specific stage—say, from the first demo to the proposal—shines a spotlight on a broken process or a gap in your team's training.
- It Optimizes Resource Allocation: When you know your conversion numbers, you can forecast revenue with much greater accuracy. That means you can put your budget and people where they’ll have the biggest impact.
- It Drives Continuous Improvement: You can't improve what you don't measure. Period. Regular tracking gives you a baseline, letting you test new messaging, tactics, or tools and see exactly how they move the needle.
How to Accurately Calculate Your Conversion Rate
Alright, let's turn this fuzzy concept into a hard number you can actually use. At its heart, the math for your sales conversion rate is pretty simple, but it gives you a powerful snapshot of how well your sales process is working.
The basic formula looks like this:
(Total Number of Sales / Total Number of Leads) x 100 = Sales Conversion Rate (%)
So, if your team rounded up 500 leads last quarter and managed to close 25 deals from that specific group, your conversion rate is 5%. That little equation is your first step to really digging into your sales performance.
But here’s the thing: the math is the easy part. The real challenge—and where most teams trip up—is agreeing on what you’re actually counting. Your final percentage is only as good as your definitions for "lead" and "sale." Without everyone on the same page, your data can get muddy, fast.
Defining Your Key Metrics
What your company calls a "lead," the team next door might just call a "contact." Honestly, the specific words don't matter as much as using them consistently. This is one of the most common pitfalls I see when teams try to track this metric.
Before you even touch a calculator, your entire team needs to agree on the answers to a couple of basic questions:
- What is a "Lead"? Is it anyone who downloads a whitepaper? Or is it someone who fills out your demo request form, practically waving their hand to say, "I'm ready to talk"? The second one is what we'd typically call a Marketing Qualified Lead (MQL) or a Sales Qualified Lead (SQL).
- What counts as a "Sale"? For a SaaS company, is it the moment a contract gets signed? Or is it when the first payment actually hits your bank account? For an eCommerce shop, it's a lot simpler—usually, it's when a customer completes checkout and the payment goes through.
Nailing down these definitions means everyone is playing by the same rules. It turns your conversion rate from a source of arguments into a genuinely reliable measure of performance.
Tailoring the Calculation to Your Business Model
A one-size-fits-all approach just doesn't work here. The way your business operates directly shapes how you should be calculating this. Different industries have completely different sales cycles and customer journeys.
Just look at the eCommerce world. We've seen massive shifts in how people buy online. The average eCommerce conversion rate jumped from 2.51% in 2018 all the way to 5.40% by mid-2023. That tells you people are getting much more comfortable buying stuff online. But then you look at a specific niche like the Baby and Child sector, and the average is way down at 1.0%. You can find more of these kinds of average conversion rate insights on Capturly. It just goes to show how specific you need to get.
Here’s how a few different business types might define their terms:
- SaaS Companies: A "lead" is often a user who starts a free trial or asks for a demo. A "sale" is usually a signed annual contract or the first monthly payment.
- eCommerce Stores: A "lead" might be a visitor who adds a product to their cart. The "sale" is the completed purchase. Simple as that.
- B2B Services: A "lead" is typically a prospect who’s gone through a discovery call and been qualified. The "sale" happens when a statement of work is signed or they make their initial deposit.
When you take the time to tweak your definitions to fit your actual sales process, you end up with a metric that's way more accurate and useful. This kind of precision is what lets you make smart, data-driven decisions instead of just guessing.
Benchmarking Your Performance Against Industry Standards
So, you’ve calculated your sales conversion rate. The next logical question is always the same: is that number any good?
Context is everything. A 2% conversion rate might be cause for a champagne toast at a B2B SaaS company with a massive deal size. But for an eCommerce store selling t-shirts? That same 2% could signal deep trouble. This is exactly where benchmarking comes into play.
Think of benchmarking as a compass for your sales strategy. It’s the practice of stacking your performance metrics up against industry averages and your direct competition. It won’t draw you a treasure map, but it will absolutely point you in the right direction and show you where you stand.
This process is critical for setting realistic, informed goals. Instead of pulling a target out of thin air, you can anchor it to what’s actually achievable in your market. It’s also a powerful way to rally your team, showing them exactly what top performers are doing.
Where to Find Reliable Benchmarks
So, where do you get your hands on this crucial data? Look for recent industry reports, market research deep-dives, and analyses from reputable analytics firms. The key is to find data that mirrors your own business—think industry, company size, region, and even target audience.
To give you an idea, the global average eCommerce sales conversion rate in 2023 hovered around 3.21%. That means for every one hundred visitors, just over three actually bought something. But that average hides a ton of variation.
Food & Beverage brands crushed it with an average 7.22% conversion rate, while Luxury & Jewelry saw a much lower 1.04%. Geography matters, too. The Americas led with 3.33%, while the Asia-Pacific region was closer to 2.47%. Even the device someone uses makes a difference, with tablets converting at 3.46% and desktops right behind at 3.45%.
Here’s a quick look at some key eCommerce benchmarks to see how different categories and devices stack up.
eCommerce Sales Conversion Rate Benchmarks by Category and Device
| Category / Device | Average Conversion Rate (%) |
|---|---|
| Industry Averages | |
| Food & Beverage | 7.22% |
| Health & Beauty | 4.91% |
| Electronics | 2.55% |
| Fashion & Apparel | 2.44% |
| Luxury & Jewelry | 1.04% |
| Device Averages | |
| Tablet | 3.46% |
| Desktop | 3.45% |
| Mobile | 2.97% |
These numbers provide a snapshot of what's happening out there, but remember they are just a starting point for your own analysis.
Interpreting the Numbers
It's tempting to see a benchmark as a hard-and-fast rule, but it’s not. Benchmarks are guidelines. Several factors completely unique to your business will always influence your numbers:
- Brand Recognition: A household name will almost always have higher conversion rates than a startup because trust is already built-in.
- Price Point: High-ticket items naturally have longer, more complex sales cycles and lower immediate conversion rates. No one impulse-buys a forklift.
- Traffic Source: Leads from a hyper-targeted email campaign should, in theory, convert way better than random visitors from a broad social media ad.
- Sales Cycle Complexity: A simple "buy now" button will always outperform a multi-stage B2B sales process that requires demos, quotes, and legal review.
This next image breaks down how different channels tend to perform and what really moves the needle.
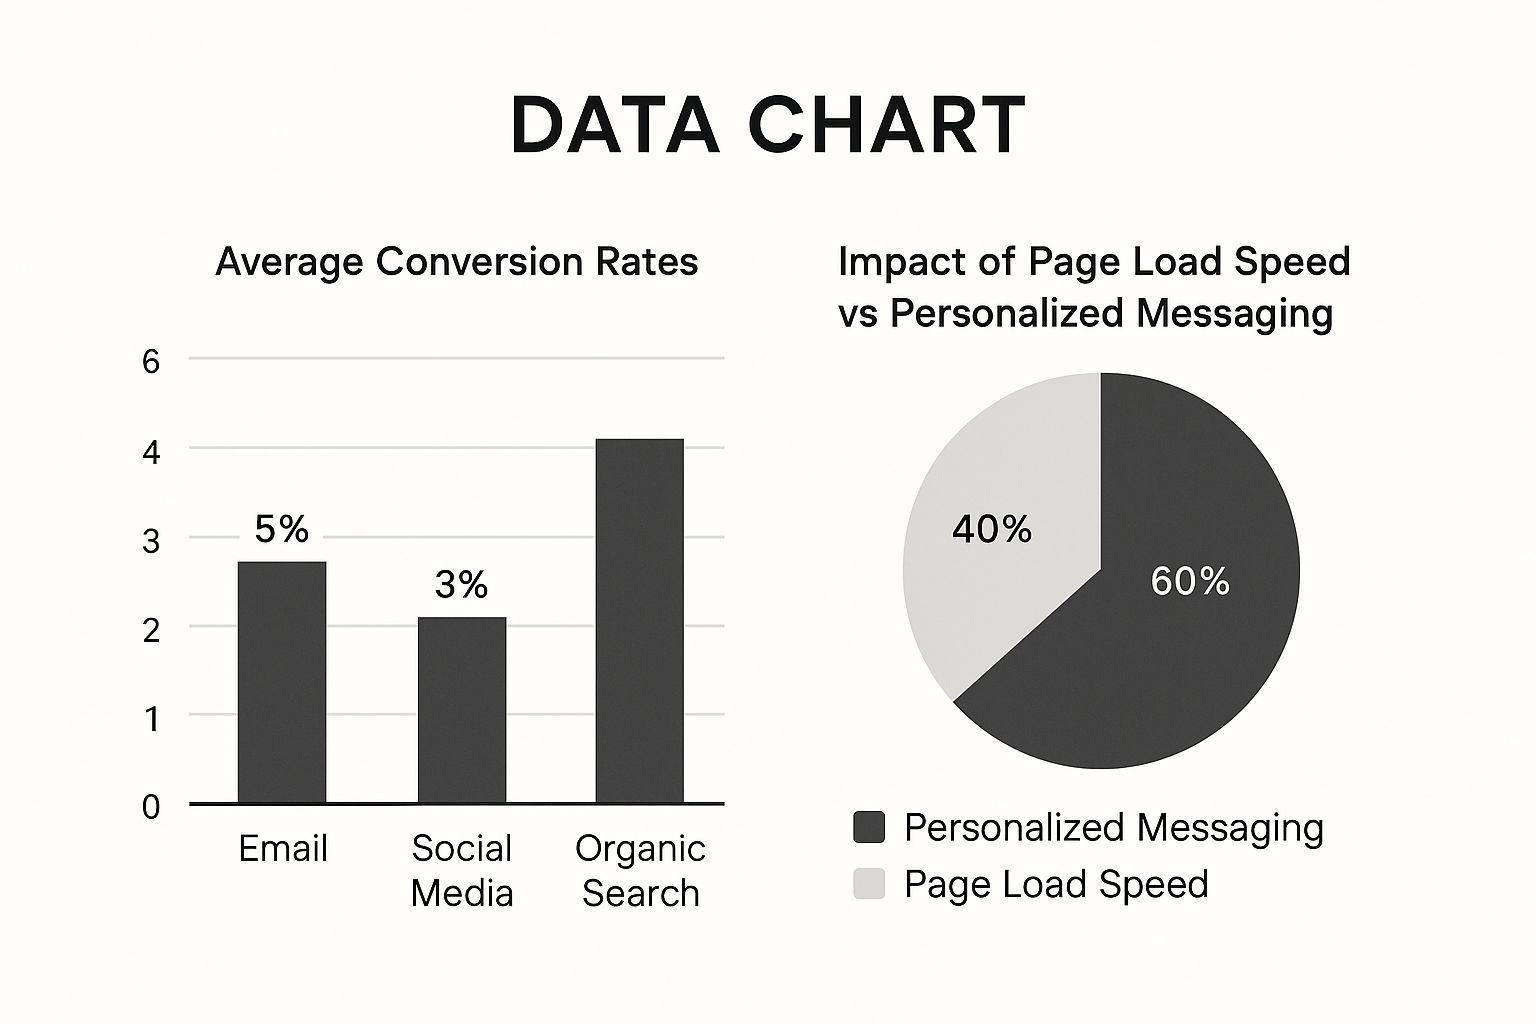
What's fascinating here is that while organic search delivers the highest conversion rates, things like personalized messaging have a bigger impact than technical tweaks like page speed. It shows that how you sell is often more important than where you sell.
Using Benchmarks for Strategic Growth
The real value of benchmarking isn't just seeing how you measure up—it's using that insight to get better. If you want to see how this looks in practice, checking out some business intelligence dashboard examples for sales can be a huge help in visualizing your data against industry standards.
The most important benchmark is your own historical performance. Your primary goal should be continuous improvement—beating your numbers from last quarter and last year.
When you combine industry data with your own internal analytics, you create a powerful framework for growth. This dual approach helps you spot where you're falling behind and tells you exactly where to focus your energy. For more on getting your team structured for this kind of success, our guide on sales operations best practices can help turn these insights into consistent wins.
Ultimately, benchmarks give you the context needed to turn raw data into a smart, actionable strategy for boosting your sales conversion rate.
Common Friction Points That Hurt Conversion Rates
So you have promising leads flowing in, but then… they vanish. It’s a frustratingly common story, but it’s rarely random. Almost every time a lead disappears, it’s because they hit a point of friction—one of those annoying, invisible roadblocks in your sales process that brings all their momentum to a screeching halt.
Think of your sales funnel like a water slide. Friction points are the rough patches that slow people down or, even worse, make them want to climb out. A little bit might go unnoticed, but enough of it will stop anyone in their tracks. The mission is to make the journey from "I'm interested" to "take my money" as smooth and painless as possible.
These deal-killers often hide in plain sight, disguised as "how we've always done things." To find them, you have to be willing to step into your prospect's shoes and experience your own sales process firsthand.
The High Cost of Slow Responses
Let’s get one thing straight: a slow response time is one of the most destructive friction points you can have. When a prospect raises their hand and fills out a demo request, their interest is at its absolute peak. Every single minute you make them wait, that interest starts to decay.
The data on this is brutal. Studies show that your odds of converting a lead drop off a cliff after just five minutes. If you take 30 minutes to respond, your chances are 21 times lower than if you’d replied in five. An hour? Forget about it. In a world full of options, a slow response is practically an invitation for your prospect to go check out the competition.
Speed isn't just a nice-to-have; it's a non-negotiable part of modern sales. A lead who has to wait is a lead you are actively losing.
This is exactly the problem tools like Distro were built to solve. By instantly routing inbound leads to the right salesperson, they get rid of those costly delays that absolutely murder your conversion rate.
Confusing Processes and Mixed Messages
Another major source of friction is simple confusion. If a prospect can’t immediately figure out what you do, how much it costs, or how to buy it, they’re not going to stick around and solve the puzzle. They’ll just leave. This is especially true for eCommerce, where a clunky checkout is the number one reason people abandon their carts.
And this isn't a small problem. Projections show that by 2025, a staggering 77.2% of mobile shopping carts will be abandoned, often because of confusing steps or surprise costs. While desktop conversion rates are better at 4.8%, mobile still drives 73% of traffic. That’s a massive gap where friction is costing businesses real money. For a closer look at these numbers, you can explore more eCommerce benchmarks on SpeedCommerce.
Look out for these common culprits:
- A Muddled Value Prop: The prospect lands on your page and still has no clue what problem you actually solve.
- Hidden Costs: Nothing kills trust faster than unexpected shipping fees or taxes popping up at the very last second.
- Too Many Steps: Forcing someone to fill out a ten-field form or click through a five-page checkout is a recipe for abandonment.
- Inconsistent Messaging: The amazing promise you made in your ad is nowhere to be found on the landing page or in the sales call.
Smoothing out these rough patches isn't just about tweaking a button or two; it requires a clear strategy. For more on structuring your funnel for success, check out our guide on sales pipeline management best practices. When you start diagnosing and fixing these friction points, you pave a much clearer—and more profitable—path for your leads to become customers.
Actionable Strategies to Improve Your Conversion Rate
Knowing your numbers and where deals are stalling is half the battle. Now comes the fun part: turning those insights into a higher sales conversion rate. The mission is to pave a smoother, more compelling path that walks a prospect from "just looking" to "take my money."
This isn't about some massive, overnight overhaul. Real, lasting growth comes from making small, consistent improvements across your entire sales process. Focus on clarity, speed, and value at every single touchpoint, and you'll see those gains start to compound.
Start with Smarter Lead Qualification
Let's be honest: not all leads are created equal. Throwing every single inquiry at your sales team is a surefire way to burn them out and tank your conversion rate. The single most impactful thing you can do is get serious about qualifying leads so your team can focus their energy where it actually counts—on people who are ready to buy.
A solid qualification framework acts like a bouncer for your sales pipeline, only letting the most promising prospects through the velvet rope. This usually means scoring leads based on a few key criteria.
- Demographics: Does this lead look like your Ideal Customer Profile (ICP)? Think company size, industry, and the person's job title.
- Behavioral Data: What have they actually done? Downloading a case study, showing up for a webinar, or lurking on your pricing page multiple times are huge green flags for buying intent.
- Budget and Authority: Can they actually sign the check, and does their company have the budget for your solution?
By putting a lead scoring system in place, you’re basically creating a priority list for your reps, ensuring they're always talking to the people who are most likely to close.
Optimize Your Calls to Action with A/B Testing
Your call-to-action (CTA) is the moment of truth. It’s the button or link—"Request a Demo," "Start a Free Trial," "Buy Now"—that asks someone to take the next step. You’d be shocked at how much small tweaks to your CTAs can move the needle on your conversion rate.
And the only way to know what really resonates is to test it. A/B testing is simple: you create two versions of a CTA, show them to different groups of people, and see which one gets more clicks.
Don't assume you know what your audience will respond to. A/B testing removes the guesswork and lets real user behavior guide your optimization efforts, often revealing counterintuitive results.
Just make sure to test one thing at a time to get clean results:
- Wording: Pit an action-oriented phrase like "Get Started" against a benefit-driven one like "See My Savings."
- Color: Does a bright, high-contrast button that pops off the page perform better? Test it.
- Placement: Try moving your CTA above the fold, at the very end of a section, or even as a banner that follows the user down the page.
Consistent testing turns your website from a simple brochure into a conversion-generating machine.
Simplify the Purchasing Journey
Every extra form field, every confusing step, every moment of hesitation is an open invitation for a prospect to bail. One of the simplest and most effective ways to boost your sales conversion rate is to ruthlessly cut the friction from your buying process.
Map out the entire journey from a customer’s perspective, from their very first click to the final "thank you" page. Look for anything—anything at all—that could cause frustration. Is your pricing crystal clear? Is the checkout process a breeze? Can someone find answers to their questions without having to dig?
According to a Databox study, even a high-performing blog might only convert visitors to leads at a rate of around 3%. Getting more than 5% of your total leads to become customers is a huge win. That tells you just how many people fall off along the way. Your job is to make that path as smooth and straightforward as possible.
Automate Lead Routing for Instant Engagement
When an inbound lead raises their hand, the clock starts ticking. Immediately. As we’ve seen, the odds of converting a lead drop off a cliff just five minutes after they hit "submit." Trying to assign leads manually is a recipe for delay, killing deals before your team even has a chance to speak to them.
This is exactly where automated lead routing tools like Distro are a game-changer. These platforms plug directly into your web forms to instantly qualify and route every new lead to the right rep based on rules you set—things like territory, company size, or product interest. This means your hottest prospects are talking to a salesperson in seconds, not hours. For a deeper dive, you can learn more about how to improve sales conversion rate using proven techniques in our detailed guide.
And this principle applies everywhere. For instance, exploring proven tactics to improve your average affiliate conversion rate can open up huge wins in specific channels. The idea is the same across the board: get rid of the manual bottlenecks, speed up the sales cycle, and engage buyers the moment their interest is highest.
Frequently Asked Questions About Sales Conversion Rates
Alright, let's wrap this up by hitting a few of the most common questions we hear from teams who are just starting to obsess over their sales conversion rate. Think of these as the final pieces of the puzzle to get you confident enough to start making smarter, data-driven moves.
What Is a Realistic Conversion Rate to Aim For?
This is the million-dollar question, and the honest-to-goodness answer is: it completely depends. The industry you're in, your business model, and especially your price point will change the definition of "good." A B2B software company selling a six-figure deal might be thrilled with a 2% conversion rate, while an ecommerce store slinging t-shirts would go out of business with that number.
Instead of getting hung up on some universal magic number, you're better off focusing on two things:
- Industry Benchmarks: Use the numbers we've talked about as a starting point. It helps to know if you're in the right ballpark compared to similar companies.
- Your Own History: This is the benchmark that truly matters. Your goal should be steady, incremental improvement. Beating last quarter's number is the real win.
How Often Should I Track My Conversion Rate?
Consistency is what you're after here, but how often you check in really depends on your sales volume. If you're running a high-volume ecommerce site, checking your numbers daily or weekly makes a lot of sense. You can spot trends and react to changes almost in real-time.
For most B2B companies, though, the sales cycles are longer and the deal volume is lower. A monthly or even quarterly review is far more practical. That timeframe gives you enough data to see real patterns and smooths out the random highs and lows that don't actually mean anything.
Don't get lost in the daily noise. Pick a reporting schedule that gives you insights you can actually act on, not just more data points to stare at. A focused monthly review is way more valuable than obsessive, constant monitoring.
What Is the One Thing I Can Do Today to Improve My Rate?
If you're looking for one change that will make an immediate impact, zero in on your lead response time. The data on this is impossible to ignore: the faster you get back to an inbound lead, the higher your odds of converting them. Even a five-minute delay can send your conversion chances off a cliff.
The single most effective way to crush this problem is to implement an automated lead routing tool. It’s a simple fix that ensures every single qualified lead gets connected with the right salesperson the instant they show interest. You capture their attention when it’s at its absolute peak, plugging one of the biggest and most expensive leaks in any sales funnel.
Ready to stop losing leads to slow follow-up? Distro instantly routes prospects to the right rep’s calendar the moment they hit "submit" on your demo form. See how sales teams are converting more inbound leads at https://distro.so.